MTBF Model for AVs - From Perception Errors to Vehicle-Level Failures (IV2022)
Summary
- from Intel + Mobileye
- RSS modelはPerception errorを考慮していなかったため、perception system error と vehicle-level failures (= collision) を紐付けた評価が必要だった
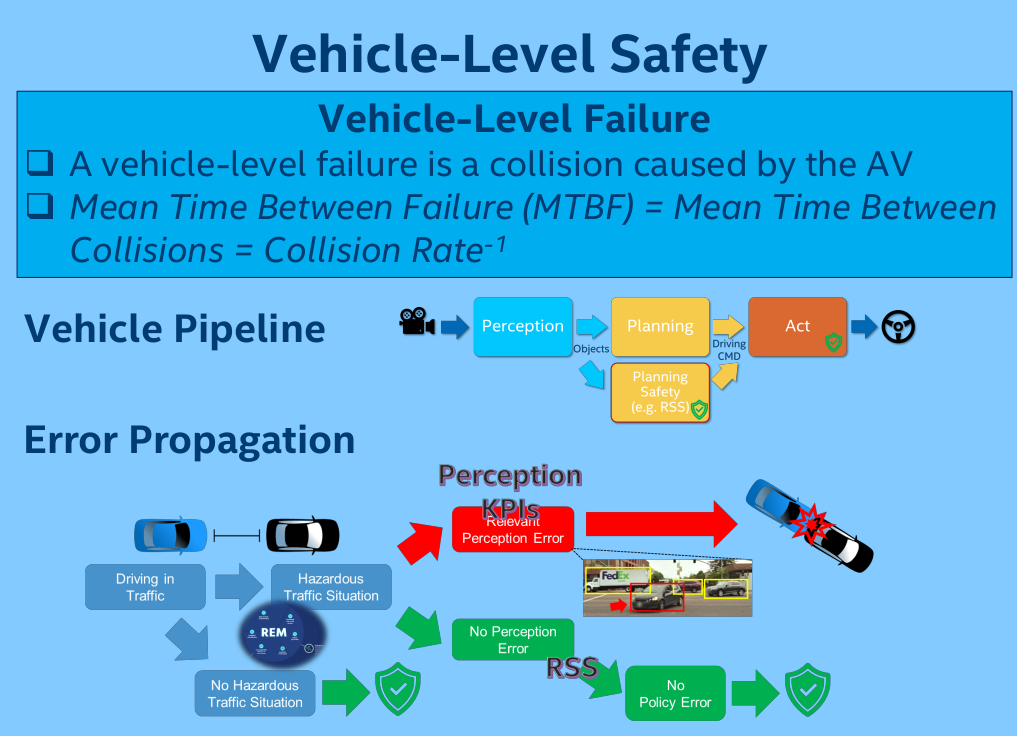
- Perception errorを考慮した自動運転車両の安全性のEvaluation modelとして、Mean Time Between Failure (MTBF) models の提案
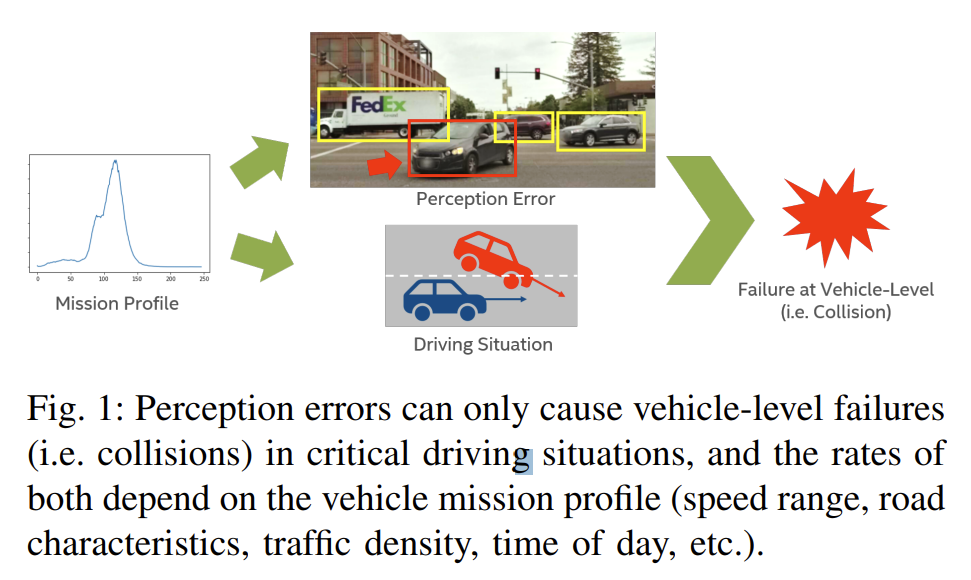
- Situation
- Vehicle mission profile (speed range, road characteristics, traffic density, time of day)
- Potentially dangerous Situation
- Perception Errorの種類
- の重み和を用いて衝突するprobabilityを計算する、というのが基本的な考え方
Background
- “Responsibility Sensitive Safety” (RSS) model
- Planning error における safety frameworks
- Perception errorはしない仮定を置いていた
Method

Safety Relevant and Severe Perception Errors
-
Typeを2つに分ける
- Type.1 False Positive / Underestimate distance or speed
- 実際には車がいないのに、認識器はいると判断
- 要らない急ブレーキかけちゃう危険性
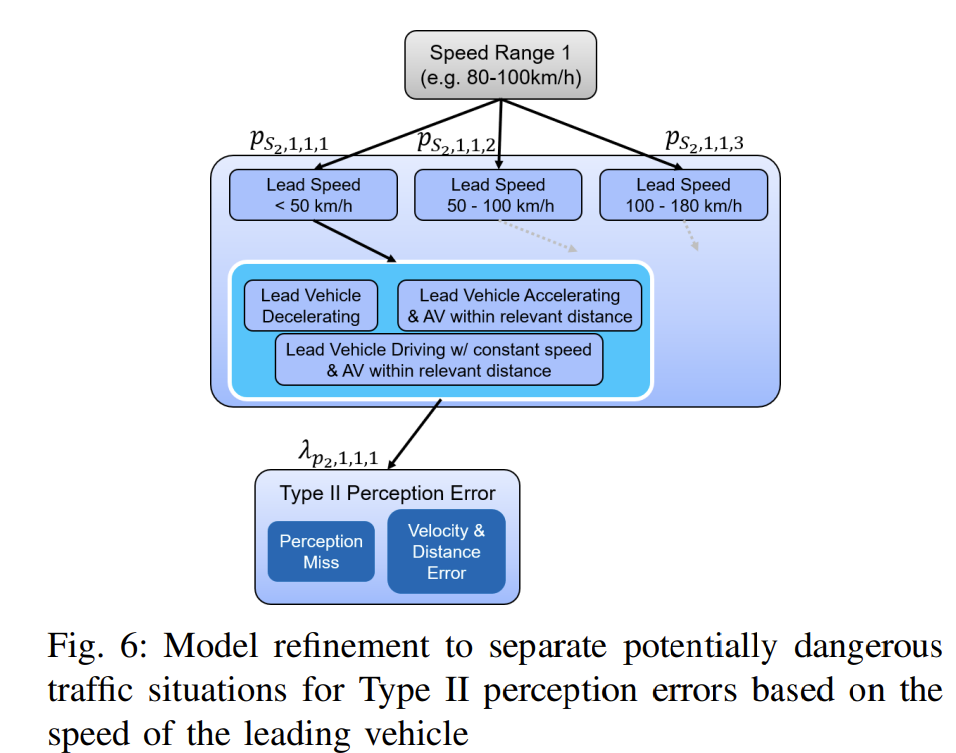
- Type.2 False Negative / Overestimate distance or speed.
- 実際には車がいるのに、認識器はいないと判断
- 前方のブレーキに間に合わない
- Type.1 False Positive / Underestimate distance or speed
-
Safety-Relevant Perception Error (KPI)
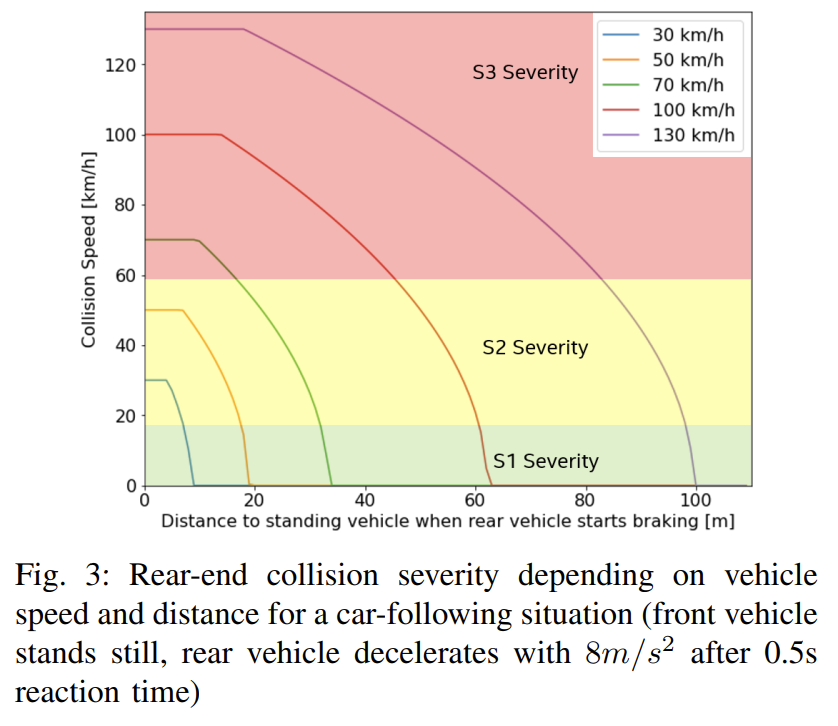
- ISO 26262 defines four classes of severity, S0 to S3
- Safety decision of the AV planning module (RSS) is changed
Potentially Dangerous Traffic Situation
- Sever Perception Error = S2 - S3 Severity
- Hazardous (Dangerous) Traffic Situation
- Typeごとに危険因子を分解

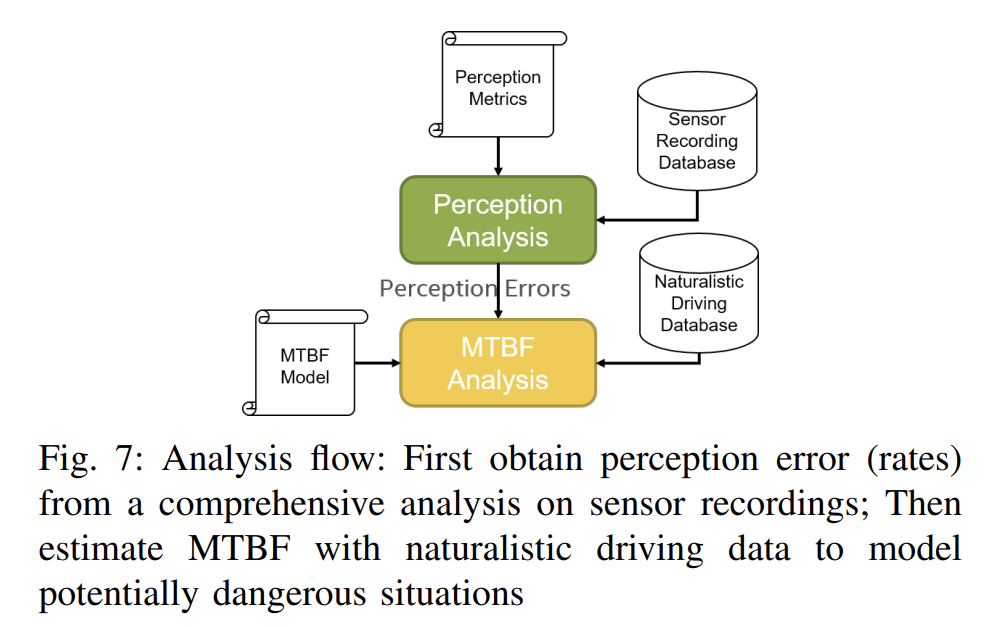
Statistical Model
- Estimate Hazardous Traffic Situation Rate
- Use naturalistic driving data (e.g. HighD, REM, etc.)
- Obtain information on how long/how often a vehicle performs certain actions (decelerating, accelerating, lane changes, driving with certain speed, etc.)
- $$ MTBF ^ {-1} = \sum_{m=\text { Mission }} p_{m} \sum_{i=\text { SpeedRange }} p_{i, m}\left[\sum_{t=\text { ErrorType }} \lambda_{p_{t, m, i}} \times p_{S_{t, m, i}}\right] $$
- $ p_{m} $: the occurrence probability of mission profile $m$
- $ p_{i, m} $: the occurrence probability of the speed range $ i $ (e.g. the range from 100 km/h to 130 km/h) for mission profile $ m $
- $ \lambda_{p_{t, m, i}} $: perception error rate
- hardwareそのものの故障とsoftwareの能力不足両方含んでいる
- $ p_{S_{t, m, i}} $: the probability of being within a relevant traffic situation

- 今回はi: speed range としたが、自由に設定できる
- 危険なsituationも自由に設定可能
Model Input
- perception error rates を得るために解析を行う
- $ d _ {per} > d _ {RSS} > d _ {real} $ -> Type 2 Error
Experiment
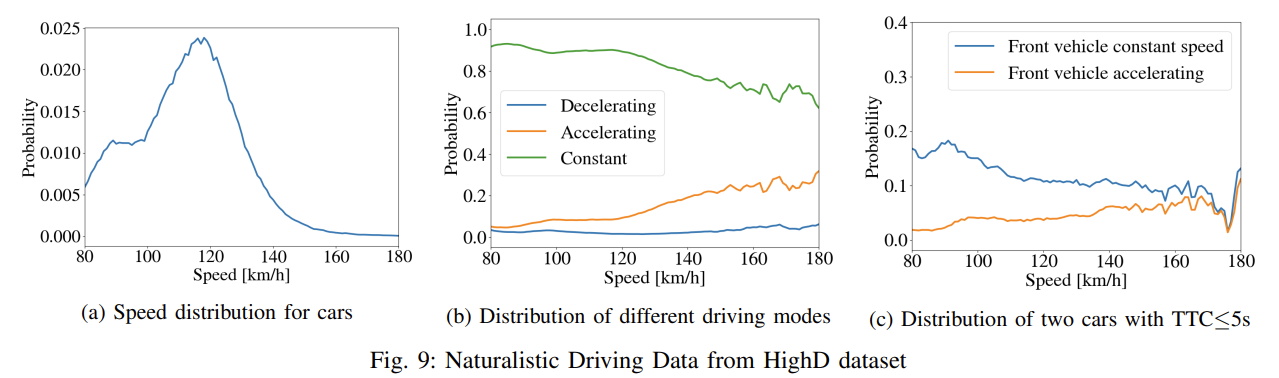
HighD dataset
- https://www.highd-dataset.com/
- Type II perception errorsのみの解析
- データセット(における視野角)的に1sec以上程度しか車が存在しないため、Type I errorは解析しても微妙なため
- lostの方が影響が大きいため、velocity and distance errors も無視
model
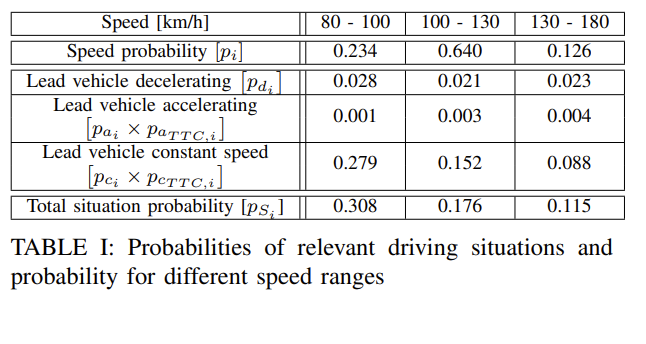
- $ p_{S_{i}} $ のmodelを以下の通りにする(situationごとに定義できる)
- $$ p _ {S _ {i}}=p _ {d _ {i}}+p _ {a _ {i}} \times p _ {a _ {T T C, i}}+\left(1-p _ {a _ {i}}-p _ {d _ {i}}\right) \times p _ {c _ {T T C, i}} $$
- We define “close” to the lead vehicle, as a TTC5 (time-to-collision) of less than 5 seconds.
- 1項
- $ p _ {d _ {i}} $: the probability of a lead car decelerating in speed range i
- 2項
- $ p _ {a _ {i}} $: the probability that the lead car is sufficiently close
- $ p _ {a _ {T T C, i}} $: the probability that the lead car accelerates
- 3項
- $ p _ {c _ {T T C, i}} $: the probability that the lead car is sufficiently close
- $ p _ {c _ {i}} = 1-p _ {a _ {i}}-p _ {d _ {i}} $: the probability that the lead car drives with constant speed
- 解析
- 80-100 km/h, 100-130 km/h and 130- 180 km/h の区分で分けることに
Extracting Perception Quality Requirements
- $$ \lambda=\sum_{i} \lambda_{i} \times p_{i} \times p_{S_{i}}=\hat{\lambda} \times \sum_{i} p_{i} \times p_{S_{i}}=: \hat{\lambda} \times \kappa $$
- $ \hat{\lambda} $: the perception error rate
- 最終的なmodel

From Perception Errors to Vehicle-Level Failures
- Lyft dataset で LiDAR detectionのみで perception errorを算出
- the severe perception miss rate (frames with misses per second) is 17/5040 s = 12.1 errors/second
- 速度は考慮無し
- the overall vehicle-level MTBF is 1523 second (0.4 hours) で目標にまだ届いていない
Discussion
- Datasetに評価するべきscenarioが包括されているか
- 評価にData augmentation を適応する時は、biasが入りやすいので慎重に
- error duration の解釈
- 1 miss * 500 frameと100miss * 5 frameでは解釈が異なるはず